[ App design ]
UX research for startups: how many people you need depends on the problem you must catch
Five users find about 85% of usability problems only if a typical problem hits about 31% of users. A problem that hits one person in ten shows up in five sessions only 41% of the time. Choose your sample from the smallest problem you cannot afford to miss, cover more tasks before adding people, and treat launch analytics as a map of where to look.
By LAIN11 min read

The best-known rule in UX research says that five users find about 85% of usability problems. It is true, as an average, for problems that hit about one user in three. For a problem that hits one person in ten, five sessions show it only 41% of the time. So the useful question is not "how many users", but what is the rarest problem I cannot afford to miss. Everything below follows from that: sample sizes for tests and interviews, how to ask without leading, how to rank what you find, and what the numbers can show once you have launched.
What five users actually promises
The model behind the rule says the share of problems found is 1 minus (1 minus p) to the power n, where p is the chance that any one user runs into a given problem and n is the number of users. Nielsen and Landauer (1993) put the typical p at 31%, averaged across the projects they studied, and Nielsen's write-up for Nielsen Norman Group (NN/g) adds that the formula holds only for comparable users using the site in fairly similar ways. Five users and p of 31% is where 85% comes from. We worked out the same formula for other values of p; MeasuringU's published table agrees (41% at five users and p of 10%).
| A problem that hits | 3 users | 5 users | 8 users | 15 users | Users for a 90% chance |
|---|---|---|---|---|---|
| 1 in 2 (50%) | 87.5% | 96.9% | 99.6% | 100% | 4 |
| About 1 in 3 (31%) | 67.1% | 84.4% | 94.9% | 99.6% | 7 |
| 1 in 5 (20%) | 48.8% | 67.2% | 83.2% | 96.5% | 11 |
| 1 in 10 (10%) | 27.1% | 41.0% | 57.0% | 79.4% | 22 |
| 1 in 20 (5%) | 14.3% | 22.6% | 33.7% | 53.7% | 45 |
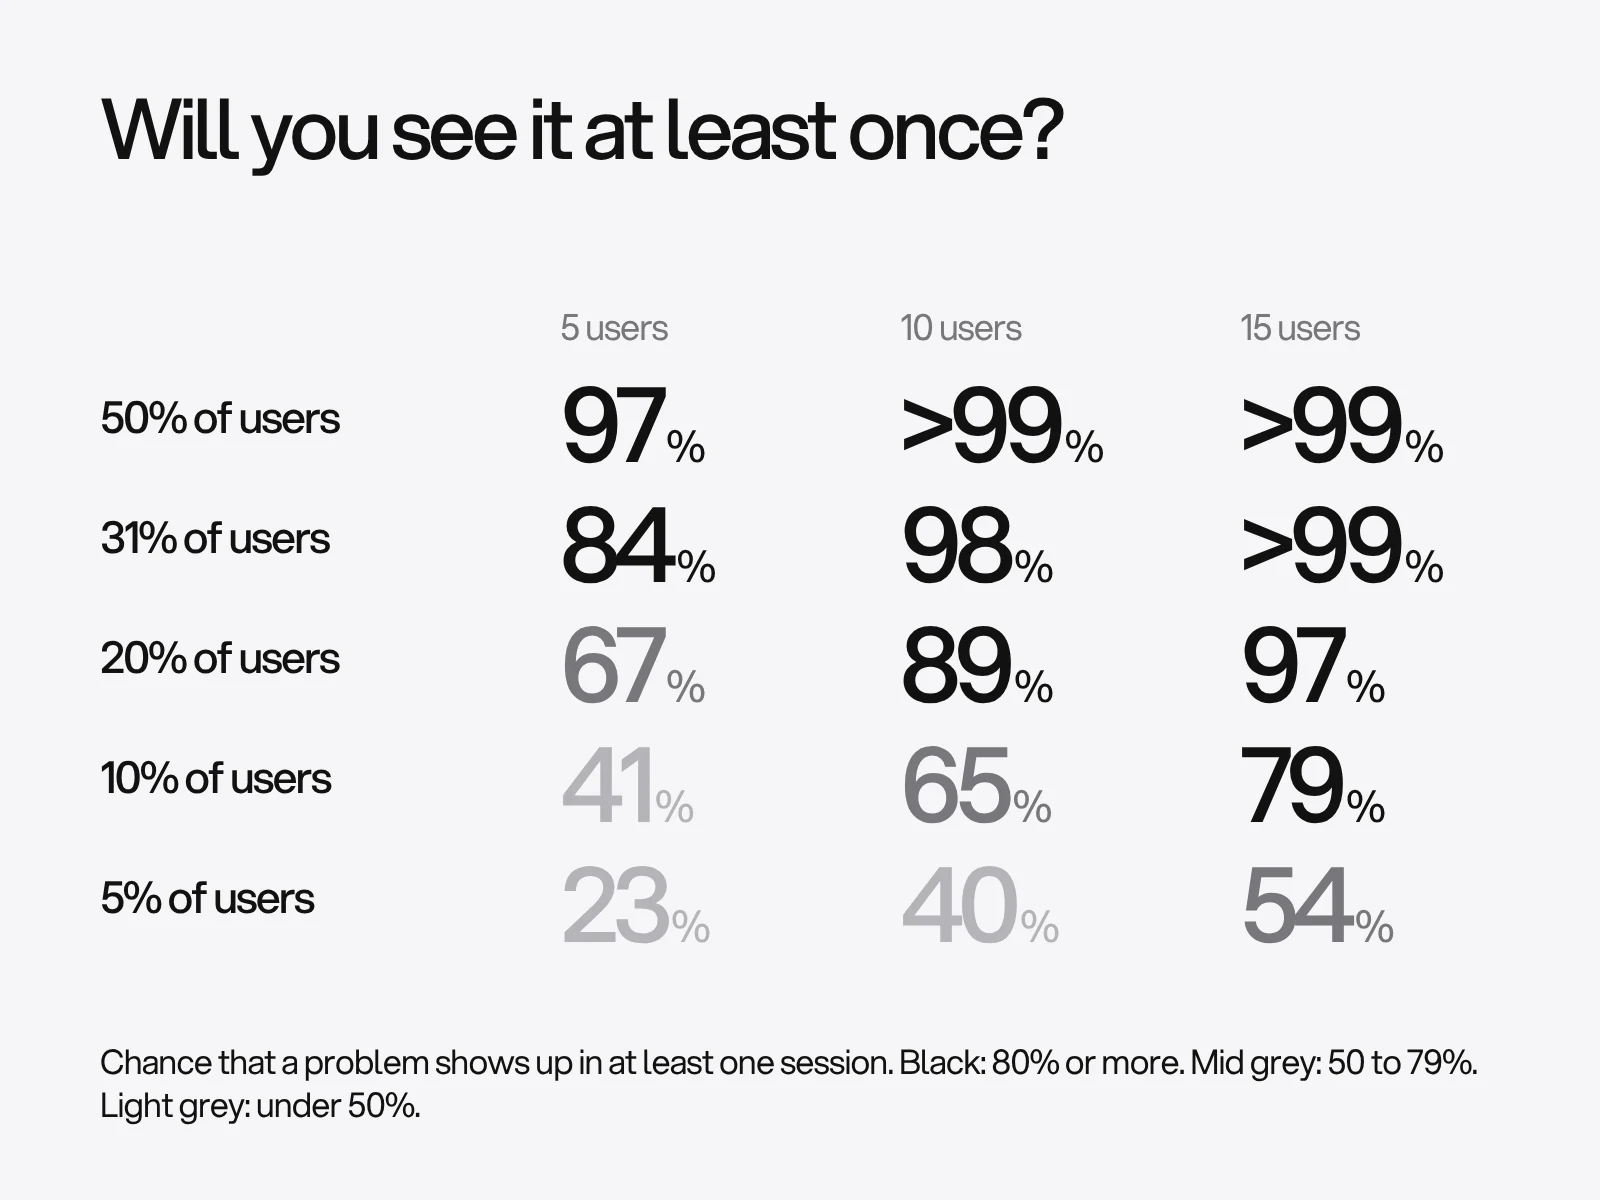
Read the table by row. Five sessions will almost always show a problem that hits half your users, and will miss most problems that hit one in ten. Real data is less tidy than the average:
- Spool and Schroeder (2001) tested four shopping sites. On one, the first five participants found 35% of the problems, new problems kept appearing through all 18 participants, and serious ones that stopped a purchase surfaced only with the 13th and 15th. We saw this only through secondary summaries.
- Faulkner (2003) drew random groups from 60 real users of one application. Groups of five found anywhere from 55% to 99% of the problems, averaging about 85%. At ten users the worst group found 80%, and at twenty, 95%. The average held, but a single group of five could find half.
- Lindgaard and Chattratichart (2007) analysed nine commercial teams from the CUE-4 comparison and argued that covering more tasks mattered more than adding users. We read only their summary.
Sources disagree, and the way to reconcile them is to treat the five-user rule as a statement about common problems. What follows from it:
- Cover tasks before adding people. Five users on three tasks see a thin slice of the product.
- Test each distinct group separately. NN/g suggests three or four users per group for two groups, and three per group for more.
- Test in rounds. NN/g prefers three studies of five, with fixes between them, to one study of fifteen.
- Do not sample for rare disasters. A payment that fails for one customer in fifty is unlikely to turn up in a test. Log errors and watch for them in analytics.
- Steve Krug's version is the smallest that still works: about three participants, one morning a month, a debrief over lunch. He concedes it is not statistically valid, and argues it still shows the worst problems.
Interviews: know what you are saturating
NN/g says there is no golden number for interviews. Start with five or six and add people until new ones stop teaching you anything. Its examples of published figures run from 5 to 50: Griffin and Hauser estimated 20 to 30 interviews for customer needs, and Guest, Bunce and Johnson found saturation by 12.
The most useful finding is that saturation has two meanings. Hennink, Kaiser and Marconi (2016) analysed 25 interviews from one study and found that code saturation, the point where you have heard each theme, came at nine interviews. Meaning saturation, where you understand why well enough to rely on it, took 16 to 24. For a startup that is a design rule: nine interviews tell you what the problems are; designing from the reasons needs about twice that. Both results come from fairly homogeneous groups, so two customer segments mean two rounds.
A stopping rule that works in practice (ours, not from those papers): after every interview, add what was new to a running list, and stop when two interviews in a row add nothing.
For the questions, the Mom Test (Rob Fitzpatrick) gives the rules most startups need: talk about the person's life, not your idea; ask about specific past events; and treat three kinds of fluff as noise, which are generic claims ("I always"), future promises ("I would") and hypotheticals ("I might"). A meeting that ends with a next step, such as time, an introduction or money, is evidence. A compliment is not. NN/g gives the measured reason: across studies, stated preference correlated with measured performance at 0.44 for PC applications and 0.53 for websites. Squared, that is about 19% and 28% of the variation, so liking predicts a fifth to a quarter of how well something works.
A six-question script:
- Tell me about the last time you [did the job]. What happened?
- What did you do first? Then what?
- What was the hardest part, and what did you do about it?
- What did you already try to fix it, and what did that cost you in time or money?
- Who else had a say in how it got done?
- Who else should I talk to?
Write tasks that do not name the interface
NN/g's rules for task scenarios are to make them realistic, make them something to do and not to describe, and avoid clues. GOV.UK's research team calls the failure trigger words: words on the page that steer people, such as "Can you add something to your basket?". Their neutral version is "Show me how you buy the shirt." Here is the same fix applied to two published LAIN designs. These are illustrations of task wording, not accounts of research we ran.
| Weak task | What is wrong | Better task |
|---|---|---|
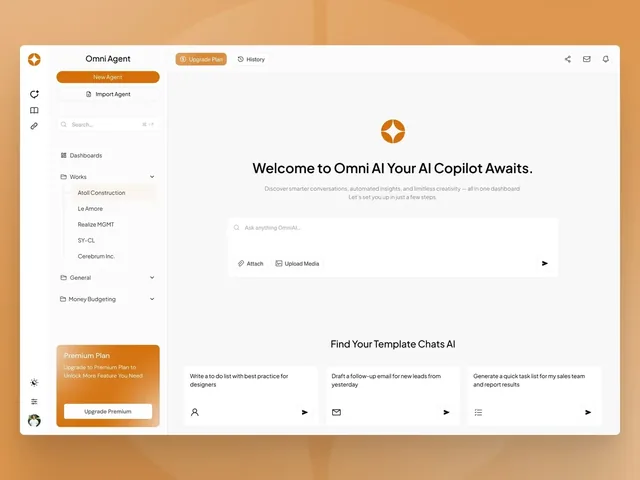
| Use the composer to start a chat from a template card (Omni Agent dashboard, one composer and three starting points) | Names two interface parts | You need a summary of what is due this week. Show me how you would get it |
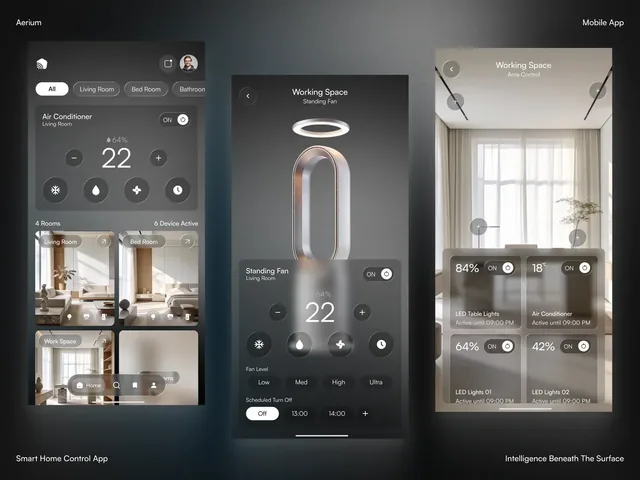
| Open the fan screen and set cooling mode (Aerium app, with temperature, four modes, fan level and a timer) | Names the screen and the setting | The bedroom is too warm and you want it cooler tonight. Show me |
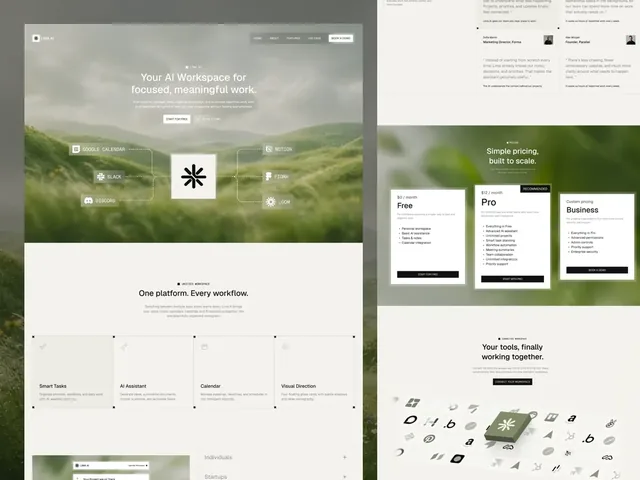
| Click Pricing and tell me which plan is cheapest | Names the link | Find out what this would cost for a team of five |
Talk less than you want to. NN/g describes three moves. The echo repeats the participant's last words with a questioning tone, using their exact words. The boomerang answers a question with a neutral one, such as "What would you normally do?". The Columbo asks half a question and trails off. Do not answer "Do I need to register?" with "No, that's fine".
On thinking aloud, evidence is mixed. Van den Haak, de Jong and Schellens found that thinking aloud while working hurt task performance on a library catalogue, while a University of East Anglia study of 30 participants found no effect on performance, and the concurrent group reported more interface problems. So think aloud to find problems, and do not time tasks while people do it.
Rate severity before you fix anything
NN/g, following Nielsen, sets severity from three factors: how often it happens, how hard it is to get past, and whether it persists after people learn it. A single rater is unreliable, and the mean of three is acceptable. A rubric for a small team, built on those factors (the thresholds are our judgement):
| Impact | What you saw | Fix when |
|---|---|---|
| 4 | The person gave up, or finished with the wrong result | Before release, whatever the count |
| 3 | They needed help from you | This round, if 2 of 5 or more hit it |
| 2 | They hesitated or backtracked and recovered alone | When 3 of 5 or more hit it |
| 1 | A cosmetic comment | Log it |
Raise a problem one level if someone hits it again after learning it. Two people score separately, take the higher number when they differ by one, and talk when they differ by two.
After launch: what small numbers can and cannot show
Once real people use the product, three standard calculations tell you how much to trust a count. They are ours, from the usual formulas.
| Question | Result |
|---|---|
| Sign-ups needed per variant to detect 20% rising to 30% | 294 |
| 20% rising to 24% | 1,683 |
| 5% rising to 6% | 8,158 |
| Responses for a survey with a margin of error of 5 points | 385 (97 for 10 points) |
The A/B figures assume a two-sided test at 5% significance, 80% power and an even split; a simulation of 20% against 30% and 20% against 24% gave 82% and 79% power. At 200 sign-ups a week, 5% to 6% would take about 82 weeks. Small funnels are just as loose: if 1 of 5 people reach a step, the true rate is anywhere from 4% to 62% (95% Wilson interval). If 0 of 10 hit a bug, it could still affect up to 28% of people. Below a few thousand visitors a month, use analytics to choose where to watch people, and use sessions to learn why.
Where it goes wrong
| Failure | Cause | How to see it | Fix |
|---|---|---|---|
| A compliment counts as evidence | People say what they think you want to hear, and cannot predict their own future | Notes full of "would", "might" and "love" | Score only specifics and next steps |
| Leading tasks | Task text uses the interface's own labels | A task contains a word that is on the screen | Write goals, and pilot with a colleague |
| Wrong participants | Friends and power users are easy to find | Everyone already knows the product | Recruit past customers, demo requests and sign-ups who left |
| One session rewrites the roadmap | A single user sees about a third of the problems on average and can be an outlier | A change made after one sighting | Act on one sighting only at impact 4; wait for a second otherwise |
| The prototype is tested, not the product | Dead links and fake data | Participants comment on what is missing | Make the tested path complete and real |
A rhythm for a small team
| Decision | Method | People |
|---|---|---|
| What to build | Interviews | 9 to 12 per segment, 16 or more to design from the reasons |
| Whether people can do the task | Usability test | 5 per round, up to three rounds, tasks covering the whole journey |
| Where people leave | Analytics | Everyone, read with intervals |
| Which of two designs | A/B test | Only if you can reach the sample sizes above; otherwise run sessions |
How this fits a project
The first LAIN phase, Alignment, is about learning your goals, brand and audience before any screen exists. Findings from interviews or tests you have already run make that phase sharper. An app or dashboard design project takes 8 to 12 weeks, and a clickable prototype is the natural thing to put in front of five people before development. The Omni Agent, Aerium and Lima AI pages show the kind of interface those sessions would use. To go on from here, read UI vs UX design and onboarding UX design. If you are about to design a product and want help choosing what to test, start a project.
Frequently asked questions
How many users do you need for a usability test?
Five per round is a good default for finding common problems, because a problem that affects 31% of users, the average in the Nielsen and Landauer data, shows up in five sessions about 84% of the time. For problems that affect one user in ten you would need about 22 users for a 90% chance. Test each distinct user group separately and cover several tasks.
Is the five-user rule wrong?
It is an average, not a guarantee. Nielsen Norman Group says the 31% problem rate behind it is an average and holds for comparable users. Faulkner found random groups of five caught between 55% and 99% of problems, and Spool and Schroeder found only 35% on one site. Use five for rounds of common problems and iterate.
How many interviews should a startup run?
Run until new interviews add nothing new. Research on saturation found that themes appeared by about nine interviews, but understanding the reasons behind them took 16 to 24. Run each customer segment as its own set, and stop when two interviews in a row teach you nothing.
Can a startup run A/B tests?
Rarely. Detecting a lift from 5% to 6% needs about 8,158 people per variant at 80% power and 5% significance, which is about 82 weeks at 200 sign-ups a week. Larger changes need far fewer: 20% to 30% needs 294 per variant. With low traffic, use usability sessions instead.
How do you write usability test tasks without leading people?
Write a goal in the person's own words and leave out the labels on the screen. Say "Find out what this would cost for a team of five", not "Click Pricing". GOV.UK calls words from the page trigger words, and Nielsen Norman Group advises realistic, actionable tasks without step-by-step clues.
What is the Mom Test?
Rob Fitzpatrick's rules for customer conversations: talk about their life and not your idea, ask about specific past events, and discount generic claims, future promises and hypotheticals. A compliment is not evidence. A next step, such as time, an introduction or money, is.
Sources and fact check
Facts in this article that come from outside LAIN were checked on 28 Oct 2026 against:
- Nielsen Norman Group: Why You Only Need to Test with 5 Users
- Nielsen Norman Group: How Many Test Users in a Usability Study?
- Nielsen Norman Group: How Many Participants for a UX Interview?
- Nielsen Norman Group: Severity Ratings for Usability Problems
- Nielsen Norman Group: First Rule of Usability? Don't Listen to Users
- Nielsen Norman Group: Writing Tasks for Quantitative and Qualitative Usability Studies
- Nielsen Norman Group: Talking with Participants During a Usability Test
- GOV.UK User research blog: What makes a good user research facilitator?
- MeasuringU: Specific sample sizes in problem discovery studies
- Faulkner (2003), Beyond the five-user assumption, Behavior Research Methods (PubMed)
- Hennink, Kaiser and Marconi (2016), Code Saturation Versus Meaning Saturation, Qualitative Health Research (PMC)
- University of East Anglia: When to ask participants to think aloud
- Pearson: Rocket Surgery Made Easy by Steve Krug
Timelines, services and process described here are LAIN's own, as set out on our About and FAQ pages.
[ From our work ]
[ Keep reading ]